background for contact page

Reading your Sample Report

Reading the Fluid Analysis Reports

FanPro testing facilities are ISO 17025 A2LA accredited. Your fluid analysis program is supported by a documented quality system you can depend on to deliver superior testing and customer service.


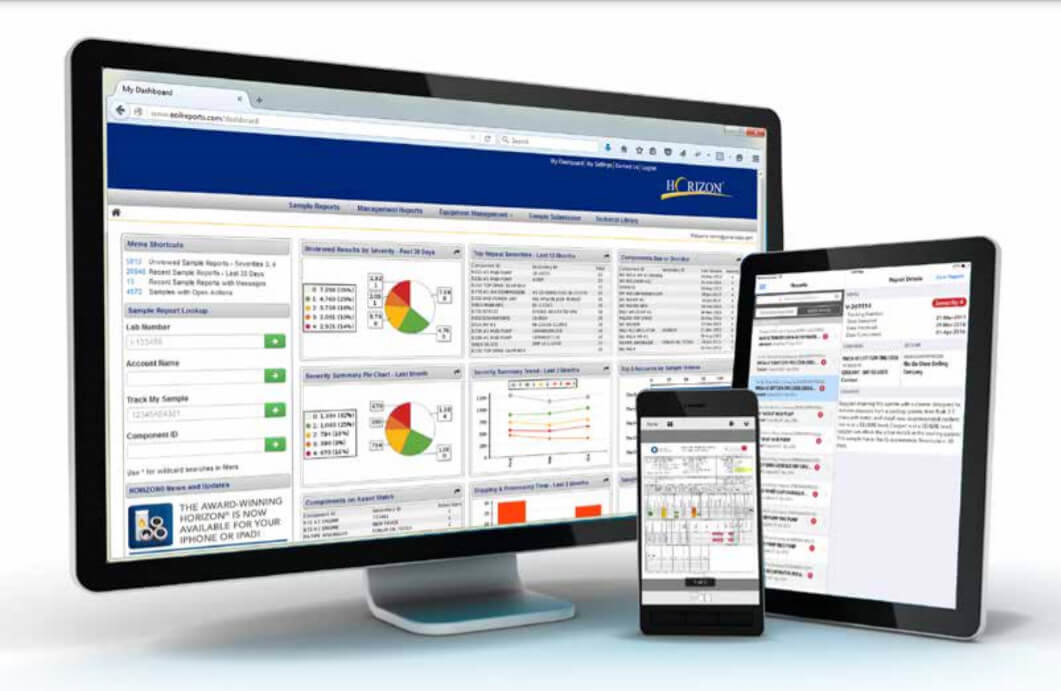
After your samples have been logged, you can track their progress through the laboratory at www.eoilreports.com. After sample processing is completed, results are soon available. HORIZON® (online reporting software program) will show you how to get the most from your data through management reports that allow you to effectively:


  • keep sampling schedules on track,  
  • identify bottlenecks in turnaround time,
  • track unit and fluid performance
  • influence purchasing decisions.


Lots of important data and recommendations for identifying/correcting root causes of abnormal conditions are produced. Read the explanations below to better understand your results.

horizon logo

Horizon reporting via pc, laptop, mobile

Total programme management is on your horizon

How to read/interpret Results & Take action to protect equipment

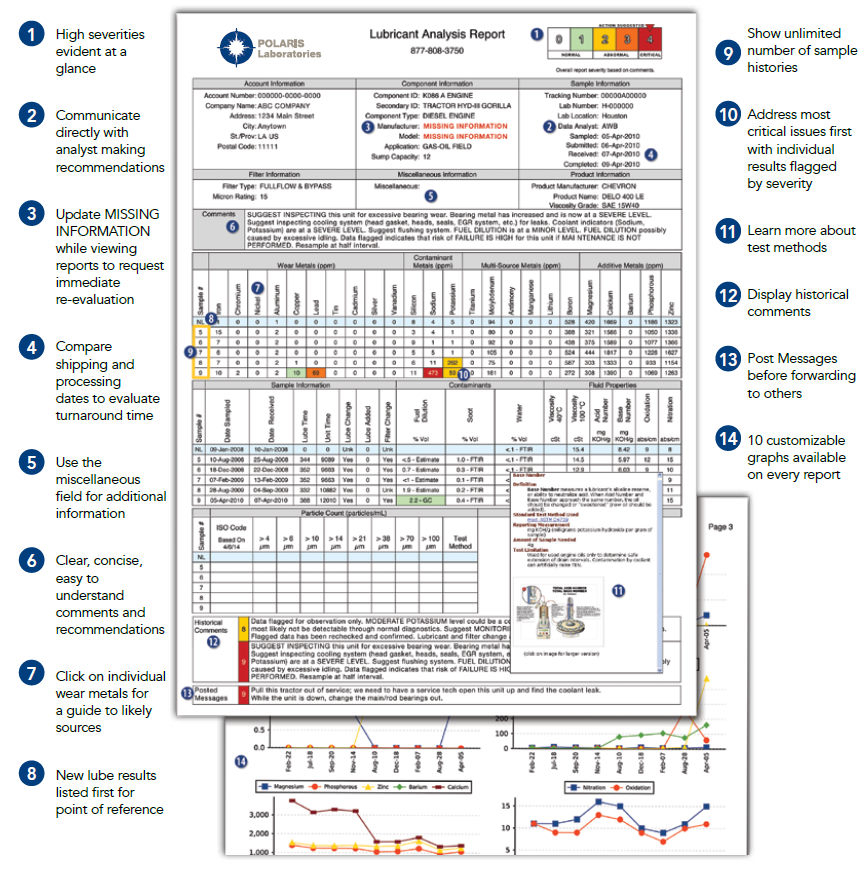
Let's walk you through the report and see how to read/interpret the results and take action to protect your equipment. When you receive a sample report, via email or if you are accessing your report via your HORIZON account, it comes with an abundance of information regarding your : 


  • sample and component information, 

  • maintenance recommendations

  • test results with elemental analysis

  • data analyst comments

  • flagged test results

  • additional resources


Test sheet Horizon

Severity Scale

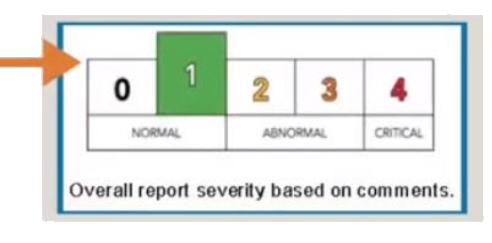
The first area to look at when you receive your report is the severity scale in the top  right corner. Severities range from zero to four on a scale of normal to critical; four being the most critical.

The overall report severity is based on both comments and test results, not just individual results.

The phone number at the top of every report lets you contact the data analyst for report clarification questions and assistance.

Severity scale

Information Section

Information Section


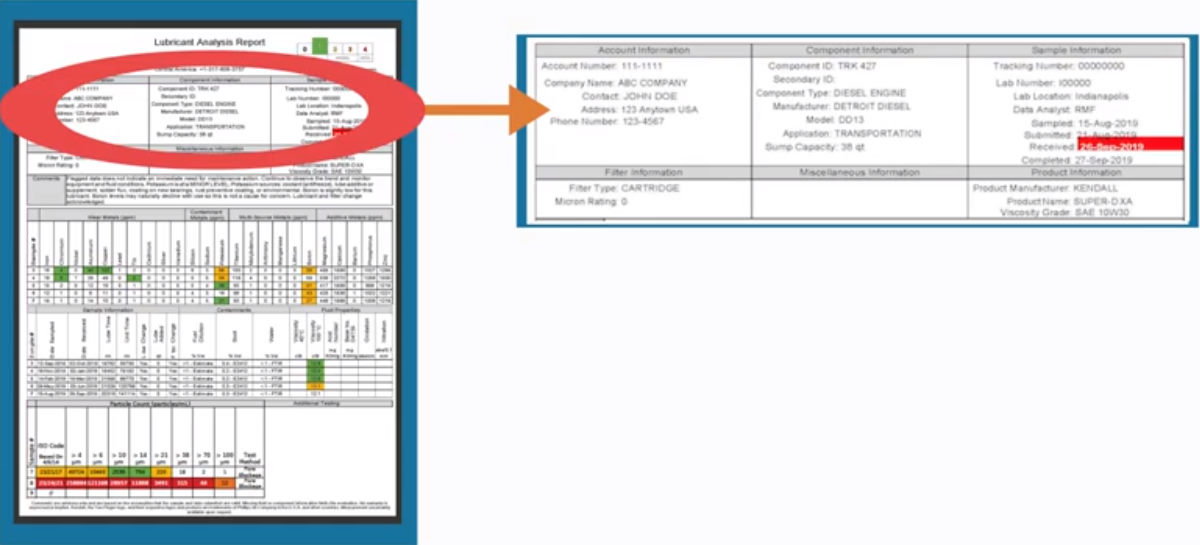
This section displays information for the account, component, sample, filter, product and other relevant data.

This section is important to review to ensure you're looking at the correct sample report.

When you submit a sample online, it is important to provide the laboratory with as much information about your sample, lubricant and component as possible. The more information our data analysts have, the more accurate our recommendations will be.

Comments Section

Comments section


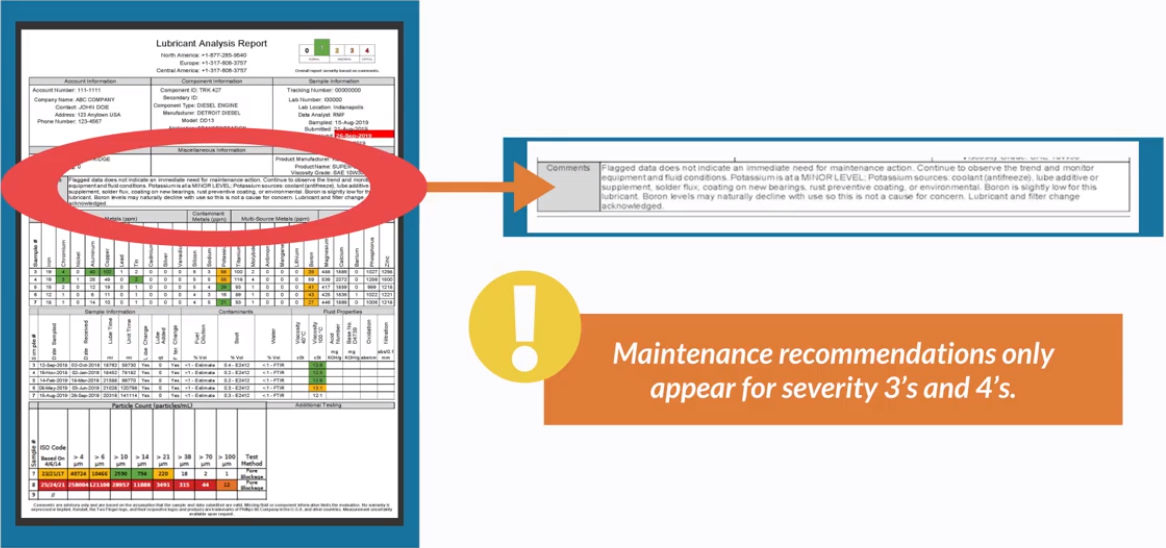
The comments section is the most important area to review on your report - more important than the severity scale.

This section includes the analysis of the test results including maintenance recommendations and feedback from our certified data analysts. Our analysts will only give a maintenance recommendation in the comments on severity three's displayed in orange and severity fours displayed in red.


This section will provide you with in-depth analysis and interpretation of the actual test results listed further down on the report.

These comments give you precise recommendations for actions, suggestions and repairs to make to fix the problem.

Actual Results

Actual Results


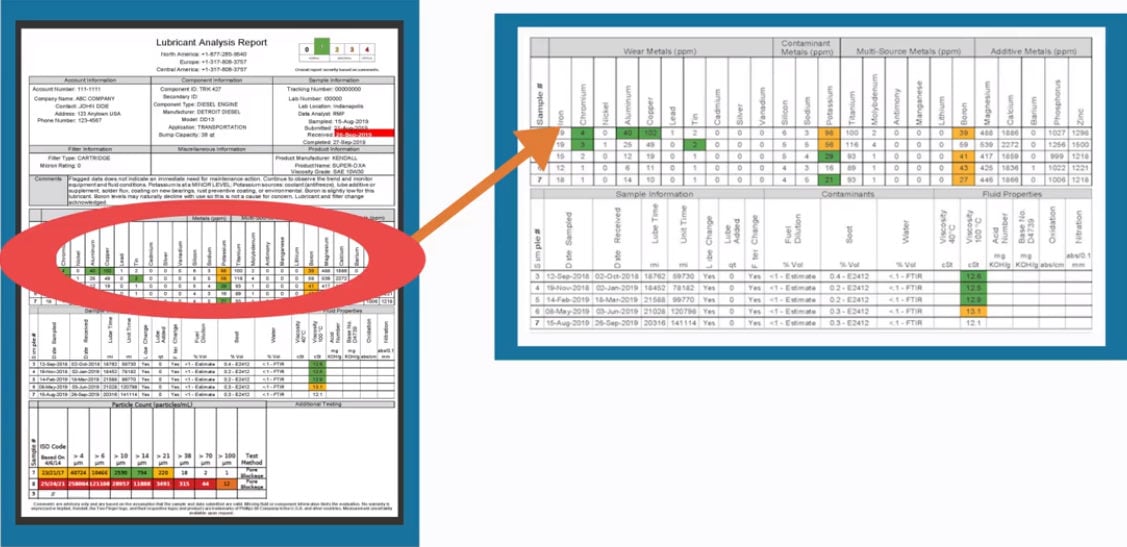
The next section on your report shows the actual results from the tests ran in the laboratory on your sample.

24 different elemental metals detect wear, contamination, multi-source and additive metals.

Sample Information

Sample Information


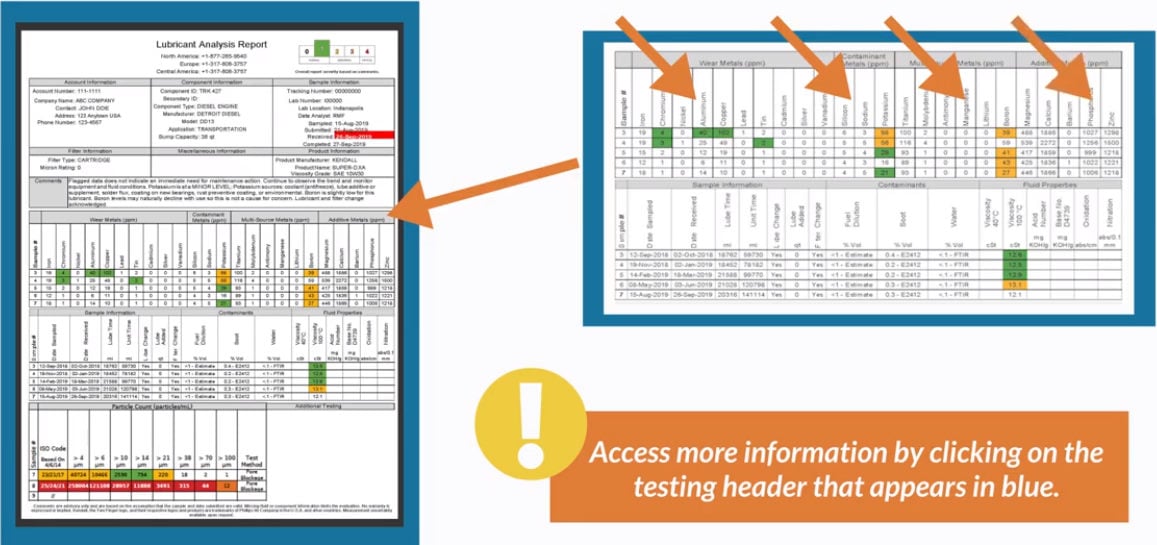
Your sample report is interactive through HORIZON.

This means you can click on the testing header and access more information about the method, instruments used and how the test is performed, in addition to possible sources and causes.


Sample Information


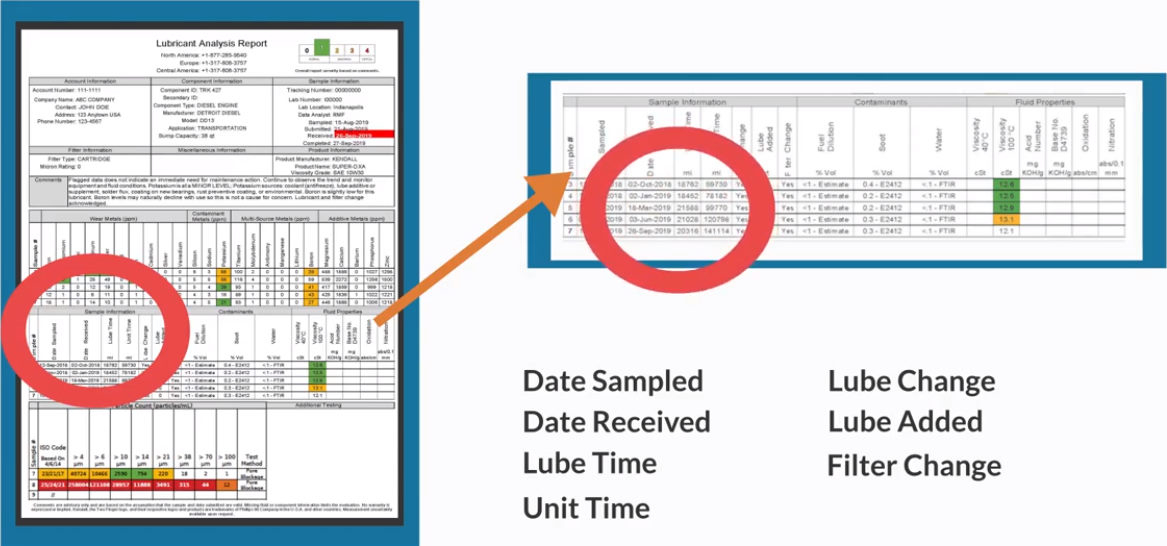
This section includes information about this exact sample such as the date it was sampled, the date the laboratory received it, lube time, unit time, lube change, lube added and filter change. Here you will see additional historical sample data for this component. It is important to include this detailed information when you submit your sample so you can establish trending for your equipment.

Historical sample data can either be displayed above or below the current results which can be customized in your HORIZON user settings.

The orientation of the report results can be controlled in your user settings.

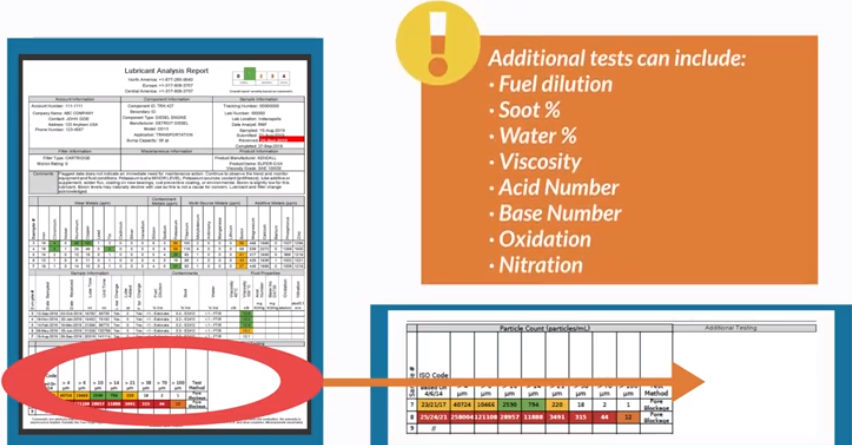
Test results for any additional testing

Test results


The next section displays test results for any additional testing ran on your sample. These results are based on your test package and fluid type. If any of these results are flagged in a colour, this means it coordinates with the level of severity for the report on the top right.

It's important to review these flagged results for the corresponding comments to determine what action to take.

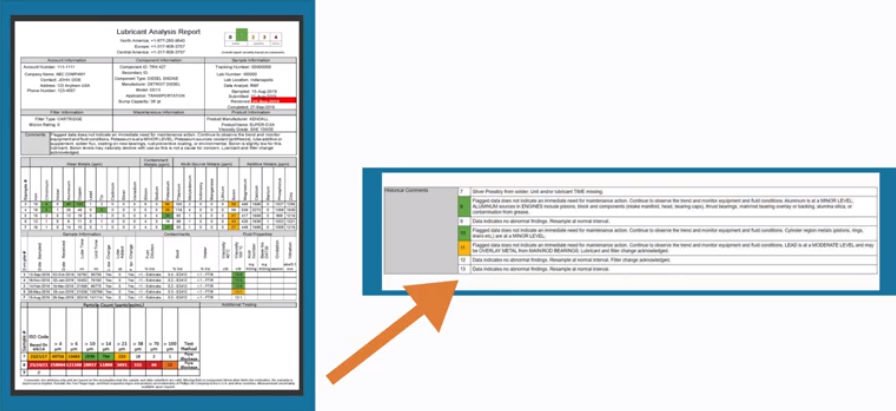
Historical comments

Historical comments


Historical comments will be pulled in from previous sample reports along with the severities for each report for this component.

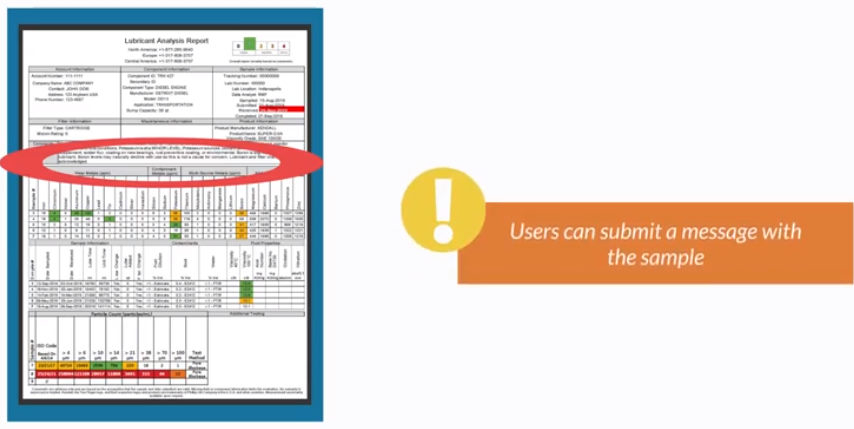
Messages

Messages

Messages appear below the comment when the user submitting the sample leaves a message with additional information when they submit the sample.

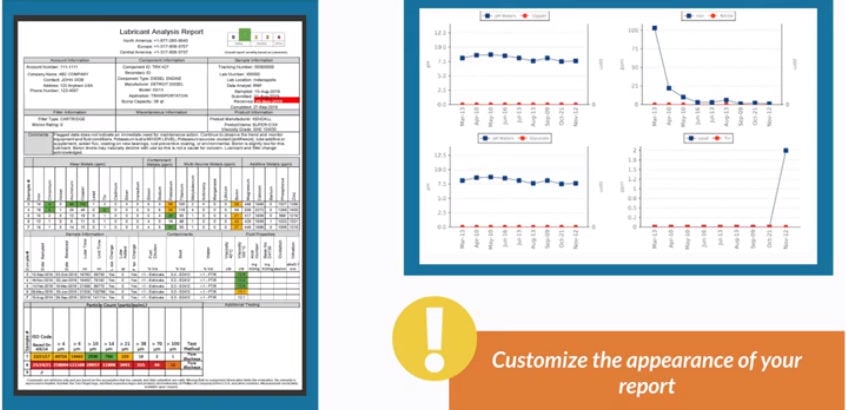
Graphs

Graphs

These graphs show a trending history of past samples for this component. The graphs displayed on the report can be selected using the sample report display settings under my settings in your HORIZON account.

As a HORIZON user, you can customise these graphs in your user settings.

Analysis Report

Analysis Report Horizon

DataConnect

This is the solution you have been looking for!